Using easy to read graphs, you'll be able to quickly spot stock trends:
- It uses a time tested formula to statistically predict the best time to buy or sell a stock, or get in or out of the market in general.
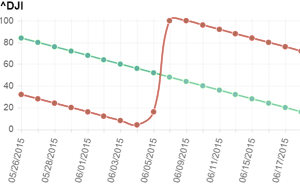
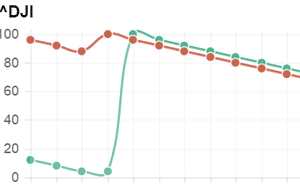
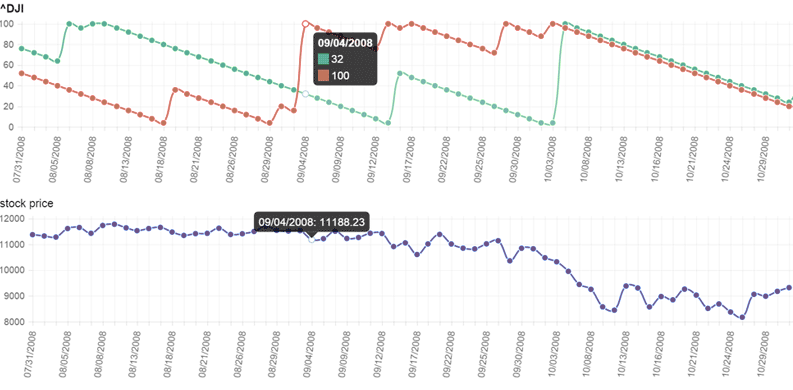
- The formula calculates how the stock is trending. The green line displays how likely it is to continue to rise. The red line predicts how likely it is to continue to fall.
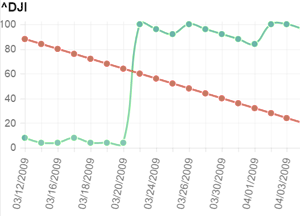
- The key is to buy when the green line jumps to 100 AND crosses the red line
or sell when the red line jumps to 100 AND crosses the green line. - PLEASE NOTE: There's no guarantees in the market, it's predicting what's most likely to happen.
- But it's been historically very accurate in making correct predictions.
- Use it as a tool to supplement informed decisions on your stock trades.
Example on How to Use:
- When the green line goes to the 100 and crosses the red line, that's the indicator to BUY (within 48 hours usually)
- When the red line goes to the 100 and crosses the green line, that's the indicator to SELL (within 48 hours usually)
- In other words, when it shows it's time to buy (or sell) the probability is higher that it will continue to go up (or go down)
- If green line crosses but there's no gap between the two lines, that does NOT mean BUY.
- Note: There are no guarantees in the market. This is a tool to help spot trends
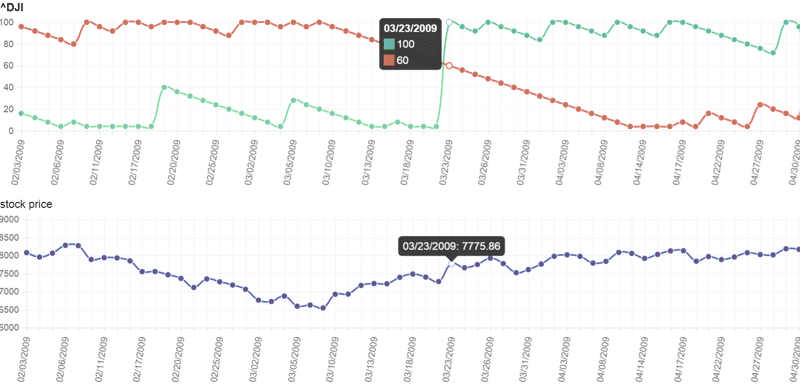
History does not necessarily prove the future. However, if you were using this chart and listened to it:
You would have sold before the market crash of 2008:
And you would have known when to get back in when the market began to recover in 2009: