It's like having a personal stock advisor
Stock Trender uses a time tested formula* to statistically predict the best time to buy or sell a stock, or get in or out of the market in general.


Stock Trender uses a time tested formula* to statistically predict the best time to buy or sell a stock, or get in or out of the market in general.
Uses a time tested formula* to statistically predict the best time to buy or sell a stock, or get in or out of the market in general.
You can choose any date range (that the stock exists for). For best results, the formula recommends at least a month period.
You don't have to re-enter the data everytime. You can save any graph with its custom data points.
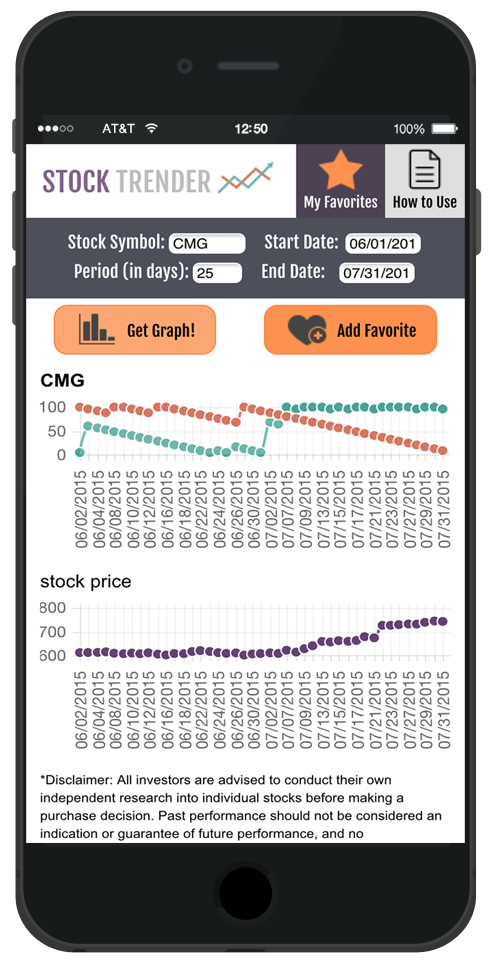
A picture is worth a thousand words. The analysis will be shown in a color line graph.
Enter stock symbol and date range, and you are done! With easy-to-read graphs, you'll be able to quickly spot stock trends. Be sure to refer to how to use page for more details.
How to use Stock TrenderSome are charging hundreds or even thousands of dollars for the service this app provides. You can use Stock Trender for a fraction of the cost!